Atomic and Nuclear Physics
DOE-HDBK-1019/1-93
RADIOACTIVITY
Rev. 0
Page 37
NP-01
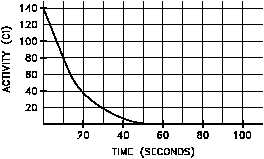
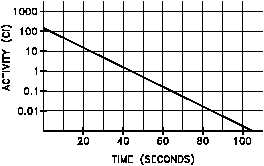
Figure 11 Linear and Semi-log Plots of Nitrogen-16 Decay
Plotting the data points calculated above on both linear and semilog scales results in the graphs
shown in Figure 11.
If a substance contains more than one radioactive nuclide, the total activity is the sum of the
individual activities of each nuclide. As an example, consider a sample of material that
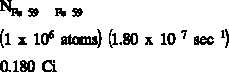
contained 1 x 10 atoms of iron-59 that has a half-life of 44.51 days ( = 1.80 x 10 sec ),
6
-7
-1
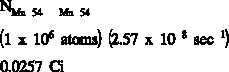
1 x 10 atoms of manganese-54 that has a half-life of 312.2 days ( = 2.57 x 10 sec ), and 1
6
-8
-1
x 10 atoms of cobalt-60 that has a half-life of 1925 days ( = 4.17 x 10 sec ).
6
-9
-1
The initial activity of each of the nuclides would be the product of the number of atoms and the
decay constant.