Vectors
VECTOR IDENTIFICATION
Rev. 0
Page 5
CP-02
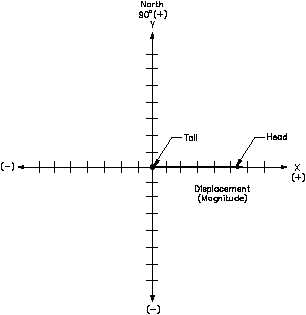
Figure 4 Displaying Vectors Graphically - Magnitude
Graphic Representation of Vectors
With the coordinate system defined, the following explanation will illustrate how to locate vectors in
that system.
First, using a ruler and graph paper, a rectangular coordinate system is laid out as described in the
previous section. The x- and y-axes are labeled. Equal divisions are marked off in all four directions.
Those to the right and above the point of origin are labeled positive (+). Those to the left and below
the point of origin are labeled negative (-).
Beginning at the point of origin (intersection of the axes), a line segment of the proper length is shown
along the x-axis, in the positive direction. This line segment represents the vector magnitude, or
displacement. An arrow is placed at the "head" of the vector to indicate direction. The "tail" of the
vector is located at the point of origin (see Figure 4).
When vectors are drawn that do not fall on the x- or y-axes, the tail is located at the point of origin.
Depending on the vector description, there are two methods of locating the head of the vector. If
coordinates (x,y) are given, these values can be plotted to locate the vector head. If the vector is
described in degrees, the line segment can be rotated counterclockwise from the x-axis to the proper
orientation, as shown in Figure 5.


