CHART OF THE NUCLIDES
DOE-HDBK-1019/1-93
Atomic and Nuclear Physics
Neutron - Proton Ratios
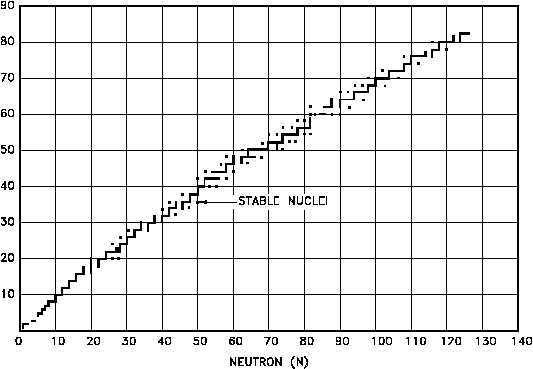
Figure 6 shows the distribution of the stable nuclides plotted on the same axes as the Chart of
the Nuclides. As the mass numbers become higher, the ratio of neutrons to protons in the
nucleus becomes larger. For helium-4 (2 protons and 2 neutrons) and oxygen-16 (8 protons and
8 neutrons) this ratio is unity. For indium-115 (49 protons and 66 neutrons) the ratio of neutrons
to protons has increased to 1.35, and for uranium-238 (92 protons and 146 neutrons) the neutron-
to-proton ratio is 1.59.
Figure 6 Neutron - Proton Plot of the Stable Nuclides
If a heavy nucleus were to split into two fragments, each fragment would form a nucleus that
would have approximately the same neutron-to-proton ratio as the heavy nucleus. This high
neutron-to-proton ratio places the fragments below and to the right of the stability curve
displayed by Figure 6. The instability caused by this excess of neutrons is generally rectified
by successive beta emissions, each of which converts a neutron to a proton and moves the
nucleus toward a more stable neutron-to-proton ratio.
NP-01
Page 14
Rev. 0