Atomic and Nuclear Physics
DOE-HDBK-1019/1-93
CHART OF THE NUCLIDES
Information for Stable Nuclides
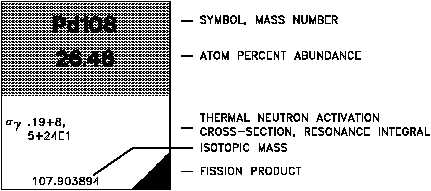
For the stable isotopes, in addition to the symbol and the atomic mass number, the number
percentage of each isotope in the naturally occurring element is listed, as well as the thermal
neutron activation cross section and the mass in atomic mass units (amu). A typical block for
a stable nuclide from the Chart of the Nuclides is shown in Figure 4.
Figure 4 Stable Nuclides
Information for Unstable Nuclides
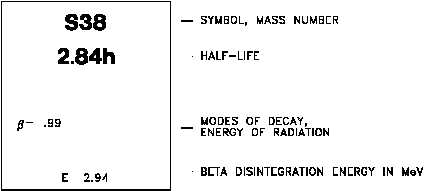
For unstable isotopes the additional information includes the half life, the mode of decay (for
example, b-, a), the total disintegration energy in MeV (million electron volts), and the mass in
amu when available. A typical block for an unstable nuclide from the Chart of the Nuclides is
shown in Figure 5.
Figure 5 Unstable Nuclides
Rev. 0
Page 13
NP-01