Thermodynamics
PROPERTY DIAGRAMS AND STEAM TABLES
Enthalpy-Temperature (h-T) Diagram
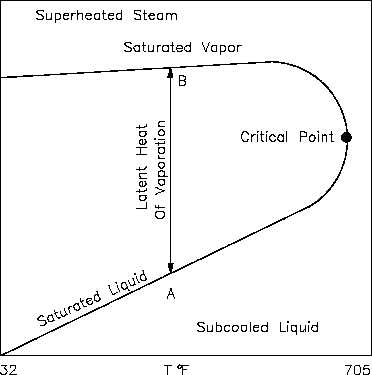
An h-T diagram exhibits the same features as on the previous property diagrams. Figure 12 is
the h-T diagram for pure water. An h-T diagram can be constructed for any pure substance. As
in the previous property diagrams, there are regions on the h-T diagram in which two phases
exist together. The region between the saturated liquid line and the saturated vapor line
represents the area of two phases existing at the same time. The vertical distance between the
two saturation lines represents the latent heat of vaporization. If pure water existed at point A
on the saturated liquid line and an amount of heat was added equal to the latent heat of
vaporization, then the water would change phase from a saturated liquid to a saturated vapor
(point B), while maintaining a constant temperature. As shown in Figure 12, operation outside
the saturation lines results in a subcooled liquid or superheated steam.
Figure 12 h-T Diagram for Water
The quality of the mixture at any point in the liquid-vapor region can be found using the same
relationship as shown for the P-h diagram.
x
h hf
hfg
Rev. 0
Page 45
HT-01