PROPERTY DIAGRAMS AND STEAM TABLES
Thermodynamics
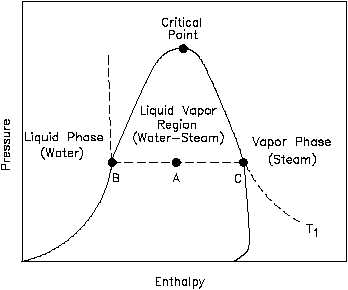
Pressure-Enthalpy (P-h) Diagram
A P-h diagram exhibits the same
Figure 11 P-h Diagram for Water
features as a P-n diagram. Figure
11 is the P-h diagram for pure
water.
A P-h diagram can be
constructed for any pure substance.
Like the P-n diagram, there are
regions on a P-h diagram in which
two phases exist together. In the
liquid-vapor region in Figure 11,
water and steam exist together.
For example, at point A, water
with an enthalpy (hf), given by
point B, exists together with steam
with an enthalpy (hg), given by
point C.
The quality of the
mixture at any point in the
liquid-vapor region can be found
using the following relationship.
h = xhg + (1 - x)hf
x
h
hf
hfg
where:
h
=
specific enthalpy of the mixture (Btu/lbm)
x
=
quality of the mixture (no units)
hg
=
specific enthalpy of the saturated vapor (Btu/lbm)
hf
=
specific enthalpy of the saturated liquid (Btu/lbm)
hfg
=
specific enthalpy change of vaporization (Btu/lbm) or hfg = hg - hf
HT-01
Page 44
Rev. 0