PROPERTY DIAGRAMS AND STEAM TABLES
Thermodynamics
Temperature-Entropy (T-s) Diagram
A T-s diagram is the type of diagram most frequently used to analyze energy transfer system
cycles. This is because the work done by or on the system and the heat added to or removed
from the system can be visualized on the T-s diagram. By the definition of entropy, the heat
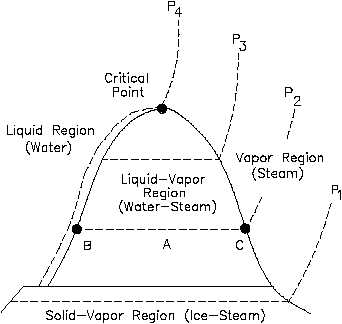
transferred to or from a system equals the area under the T-s curve of the process. Figure 13 is
the T-s diagram for pure water. A T-s diagram can be constructed for any pure substance. It
exhibits the same features as P-u diagrams.
Figure 13 T-s Diagram for Water
In the liquid-vapor region in Figure 13, water and steam exist together. For example, at point
A, water with an entropy (sf) given by point B, exists together with steam with an entropy (sg)
given by point C. The quality of the mixture at any point in the liquid-vapor region can be found
using the following relationship.
s = xsg + (1 - x)sf
x
s
sf
sfg
HT-01
Page 46
Rev. 0