SECOND LAW OF THERMODYNAMICS
Thermodynamics
The same loss of cycle efficiency can be seen when two Rankine cycles are compared (see Figure
33). Using this type of comparison, the amount of rejected energy to available energy of one
cycle can be compared to another cycle to determine which cycle is the most efficient, i.e. has
the least amount of unavailable energy.
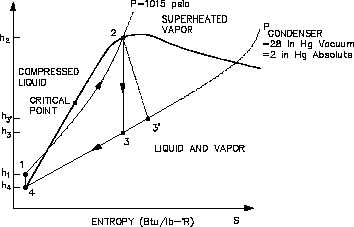
An h-s diagram can also be
Figure 34 h-s Diagram
used to compare systems and
h e l p
d e t e r m i n e
t h e i r
efficiencies.
Like the T-s
diagram, the h-s diagram will
show
(Figure
34)
that
s u b s t i t u t i n g
n o n - i d e a l
components in place of ideal
components in a cycle, will
result in the reduction in the
cycles efficiency.
This is
because a change in enthalpy
(h) always occurs when work
is done or heat is added or
removed in an actual cycle
(non-ideal).
This deviation
from an ideal constant enthalpy
(vertical line on the diagram)
allows the inefficiencies of the cycle to be easily seen on a h-s diagram.
Typical Steam Cycle
Figure 35 shows a simplified version of the major components of a typical steam plant cycle.
This is a simplified version and does not contain the exact detail that may be found at most
power plants. However, for the purpose of understanding the basic operation of a power cycle,
further detail is not necessary.
The following are the processes that comprise the cycle:
1-2:
Saturated steam from the steam generator is expanded in the high pressure (HP)
turbine to provide shaft work output at a constant entropy.
2-3:
The moist steam from the exit of the HP turbine is dried and superheated in the
moisture separator reheater (MSR).
3-4:
Superheated steam from the MSR is expanded in the low pressure (LP) turbine to
provide shaft work output at a constant entropy.
HT-01
Page 90
Rev. 0


