HEAT GENERATION
Heat Transfer
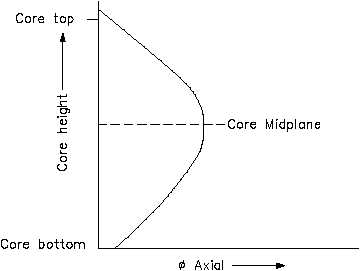
Flux Profiles
Once the type and amount of fuel
Figure 14 Axial Flux Profile
is determined, the shape of the
neutron flux distribution along the
core is established. Both radial
and axial flux distributions must
be
determined.
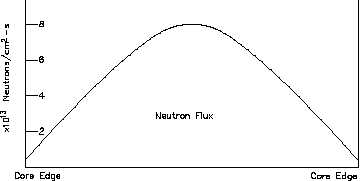
A
radial
distribution looks at flux from the
center of the core out to the edges.
An axial distribution looks at flux
from the bottom to the top of the
core. As seen in Equation 2-14,
the fission rate directly affects the
heat generation rate within a
reactor core. In the core regions
of highest flux, the highest heat
generation rate will be present.
Many factors affect the axial and
radial flux distributions, including
the number and type of control
rods, the geometry and size of core, the concentration of fission product poisons, and reflector
properties. The peak power production regions within each distribution normally occurs near the
center of the core, as indicated in Figures 14 and 15, but can vary during transients or as the core
ages.
The above figures represent the
Figure 15 Radial Flux Profile
neutron flux profiles without
considering the effects of control
rods.
Once control rods and
reflectors are taken into account,
the flux profiles become much
flatter although the peak still
occurs near the center.
The shape of the profiles can be
determined by measuring the ratio
of the peak flux to the average
flux in the distribution.
This
peaking factor is referred to as the
hot channel factor. A hot channel
factor of 1.0 would imply a flat
flux profile.
HT-02
Page 46
Rev. 0