GRAPHING
Algebra
The first step is to label the x-axis and the y-axis. Let the x-axis be temperature in °C and
the y-axis be density in g/ml.
The next step is to establish the units of measurement along each axis. The x-axis must
range from approximately 40 to 100, the y-axis from 0.95 to 1.00.
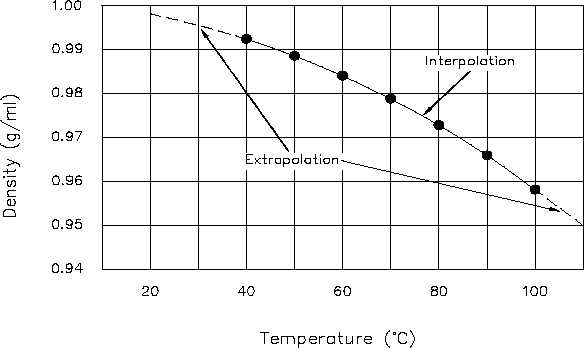
The points are then plotted one by one. Figure 3 shows the resulting Cartesian coordinate
graph.
Figure 3 Cartesian Coordinate Graph of Density of Water vs. Temperature
Graphs are convenient because, at a single glance, the major features of the relationship between
the two physical quantities plotted can be seen. In addition, if some previous knowledge of the
physical system under consideration is available, the numerical value pairs of points can be
connected by a straight line or a smooth curve. From these plots, the values at points not
specifically measured or calculated can be obtained. In Figures 2 and 3, the data points have
been connected by a straight line and a smooth curve, respectively. From these plots, the values
at points not specifically plotted can be determined. For example, using Figure 3, the density
of water at 65°C can be determined to be 0.98 g/ml. Because 65°C is within the scope of the
available data, it is called an interpolated value. Also using Figure 3, the density of water at
101°C can be estimated to be 0.956 g/ml. Because 101°C is outside the scope of the available
MA-02
Page 76
Rev. 0