Algebra
GRAPHING
Graphing Equations
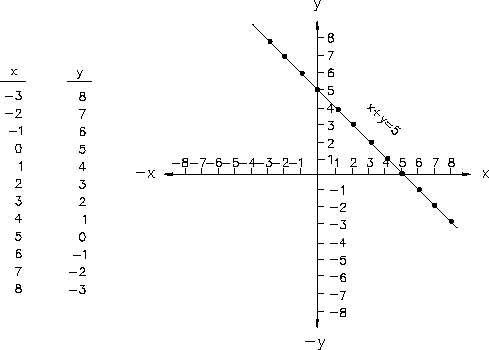
Algebraic equations involving two unknowns can readily be shown on a graph. Figure 7 shows
a plot of the equation x + y = 5. The equation is solved for corresponding sets of values of x
and y that satisfy the equation. Each of these points is plotted and the points connected. The
graph of x + y = 5 is a straight line.
The x-intercept of a line on a graph is defined as the value of the x-coordinate when the
Figure 7 Plot of x + y = 5
y-coordinate is zero. It is the value of x where the graph intercepts the x-axis. The y-intercept
of a graph is defined as the value of the y-coordinate when the x-coordinate is zero. It is the
value of y where the graph intercepts the y-axis. Thus, the x-intercept of the graph of x + y =
5 is +5. For a linear equation in the general form ax + by = c, the x-intercept and y-intercept
can also be given in general form.
Any algebraic equation involving two unknowns of any function relating two physical quantities
can be plotted on a Cartesian coordinate graph. Linear equations or linear functions plot as
straight lines on Cartesian coordinate graphs. For example, x + y = 5 and f(x) = 3x + 9 plot as
straight lines. Higher order equations or functions, such as quadratic equations or functions and
exponential equations, can be plotted on Cartesian coordinate graphs. Figure 8 shows the shape
of the graph of a typical quadratic equation or function. This shape is called a parabola. Figure
9 shows the shape of the graph of a typical exponential equation or function.
Rev. 0
Page 81
MA-02