GRAPHING
Algebra
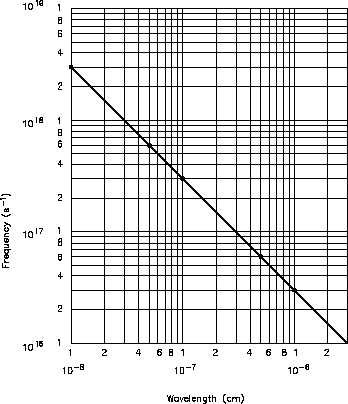
Figure 6 Log-Log Plot of Frequency vs. Wavelength
of Electromagnetic Radiation
In summary, the type of coordinate system used to plot data, cartesian, semi-log, or log-log,
should be based on the type of function to be graphed and the desired shape (curve or line) of
the curve wanted.
Cartesian system -
Linear (y = mx + b) type functions
when plotted will provide straight
lines; exponential functions (y = ex)
will plot as curves.
Semi-log system -
Should not plot linear type functions
on semi-log. Exponential functions,
such as radioactive decay and reactor
power equations when plotted will
graph as straight lines.
Log-log -
Rarely used; used to plot power equations.
MA-02
Page 80
Rev. 0