Higher Concepts of Mathematics
CALCULUS
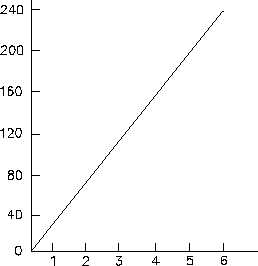
The value of the derivative ds/dt for the case
Figure 4 Graph of Distance vs. Time
plotted in Figure 4 can be understood by
considering small changes in the two variables
s and t.
Ds
Dt
(s
Ds)
s
(t
Dt)
t
The values of (s + Ds) and s in terms of (t +
Dt) and t, using Equation 5-4 can now be
substituted into this expression. At time t, s
= 40t; at time t + Dt, s + Ds = 40(t + Dt).
Ds
Dt
40(t
Dt)
40t
(t
Dt)
t
Ds
Dt
40t
40(Dt)
40t
t
Dt
t
Ds
Dt
40(Dt)
Dt
Ds
Dt
40
The value of the derivative ds/dt in the case plotted in Figure 4 is a constant. It equals 40 ft/s.
In the discussion of graphing, the slope of a straight line on a graph was defined as the change
in y, Dy, divided by the change in x, Dx. The slope of the line in Figure 4 is Ds/Dt which, in this
case, is the value of the derivative ds/dt. Thus, derivatives of functions can be interpreted in
terms of the slope of the graphical plot of the function. Since the velocity equals the derivative
of the distance s with respect to time t, ds/dt, and since this derivative equals the slope of the plot
of distance versus time, the velocity can be visualized as the slope of the graphical plot of
distance versus time.
For the case shown in Figure 4, the velocity is constant. Figure 5 is another graph of the
distance traveled by an object as a function of the elapsed time. In this case the velocity is not
constant. The functional relationship shown is given by the following equation:
s = 10t2
(5-5)
Rev. 0
Page 35
MA-05