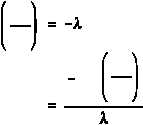
N
No e
t
4.78 x 10¹⁶ e
(0.263/yr) (12 yr)
2.04 x 10¹⁵
A
Ao e
t
A
Ao
e
t
ln
A
Ao
t
t
ln
A
Ao
t
ln
0.001 Ci
0.0108 Ci
0.263 year1
t
9.05 years
Atomic and Nuclear Physics
DOE-HDBK-1019/1-93
RADIOACTIVITY
Rev. 0
Page 35
NP-01
(c)
The number of californium atoms that will remain in 12 years can be calculated
from Equation (1-4).
(d)
The time that it will take for the activity to reach 0.001 Ci can be determined
from Equation (1-5). First, solve Equation (1-5) for time.
Inserting the appropriate values in the right side of this equation will result in the
required time.
Plotting Radioactive Decay
It is useful to plot the activity of a nuclide as it changes over time. Plots of this type can be
used to determine when the activity will fall below a certain level. This plot is usually done
showing activity on either a linear or a logarithmic scale. The decay of the activity of a single
nuclide on a logarithmic scale will plot as a straight line because the decay is exponential.


