120
110
100
90
80
70
60
50
40
0.5
0.7
1.0
2.0
3.0
4.0
5.0
7.0
10.0
Discharge time, h
Tubular
plate
Pasted plate
OPERATION AND CONSTRUCTION
DOE-HDBK-1084-95
Lead-Acid Storage Batteries
Batteries
Page 20
Rev. 0
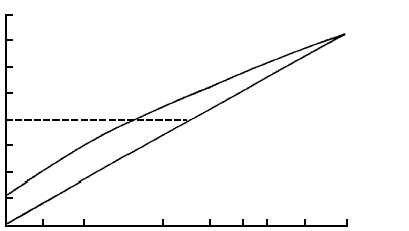
Figure 9. Typical effects of discharge rate on battery capacity.
Generating Stations and Substations .
Effects of Discharge Rate and Temperature on Capacity and Life
The rate at which a battery is discharged and its operating temperature have a profound
effect on its capacity and life. An example of the effect of discharge rate on battery capacity
is shown in Figure 9 for traction batteries. This figure shows that batteries discharged at a
low rate will be able to deliver a higher capacity than those discharged at a high rate.
The depth of discharge also affects the life of a battery. As shown in Figure 10 for a typical
traction battery, discharges beyond about 80% of capacity can be expected to shorten battery
life.
Colder operating temperatures will yield a little extra life, but also lower the capacity of lead-
acid cells. High temperatures yield higher capacity (see Figure 11) but have a detrimental
effect on life.


